Note
Go to the end to download the full example code.
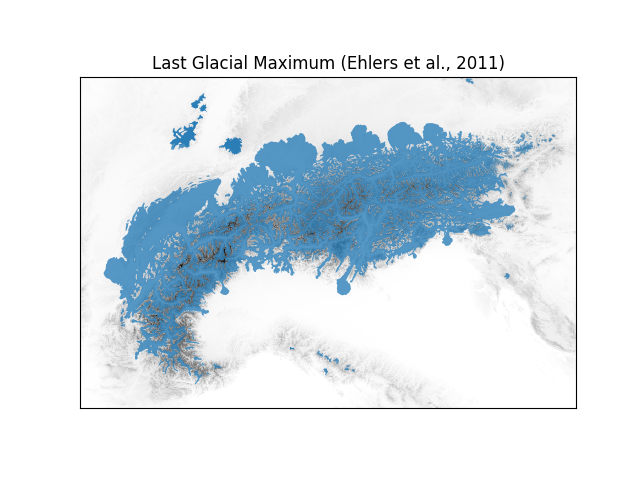
Alpine paleoglaciers#
Plot Ehlers et al. (2011) global paleoglacier data on top of gridded Alpine topographic data, whose coordinate system is read from an netCDF attribute.
downloading http://static.us.elsevierhealth.com/ehlers_digital_maps/digital_maps_02_all_other_files.zip...
/home/docs/checkouts/readthedocs.org/user_builds/hyoga/envs/stable/lib/python3.12/site-packages/shapely/constructive.py:829: RuntimeWarning: invalid value encountered in normalize
  return lib.normalize(geometry, **kwargs)
/home/docs/checkouts/readthedocs.org/user_builds/hyoga/envs/stable/lib/python3.12/site-packages/shapely/constructive.py:829: RuntimeWarning: invalid value encountered in normalize
  return lib.normalize(geometry, **kwargs)
import matplotlib.pyplot as plt
import hyoga

# open demo data
with hyoga.open.example('pism.alps.in.boot.nc') as ds:

    # plot model output
    ds.hyoga.plot.bedrock_altitude(vmin=0)
    ax = ds.hyoga.plot.paleoglaciers(alpha=0.75)

# set title
ax.set_title('Last Glacial Maximum (Ehlers et al., 2011)')

# show
plt.show()
Total running time of the script: (0 minutes 1.753 seconds)