Ctrl+K
hyoga 0.3.2 documentation - Home

User guide

  • Getting started
  • Xarray datasets
    • Opening datasets
    • Plotting glacier data
    • Plotting shaded relief
    • Plotting vector graphics
    • Masking and selection
    • Spatial interpolation
  • Examples gallery
    • Glacier data
      • Surface contours
      • Ice margin
      • Surface velocity
      • Surface streamplot
      • Bedrock isostasy
      • Bedrock erosion
    • Interpolation
      • Interpolated with surface topo
      • Interpolated streamplot
      • Profile interpolation
      • Grid refinement
    • Shaded relief
      • Bedrock altitude
      • Bedrock altitude contours
      • Hillshade colormaps
      • Colormap reference
      • Multidirectional hillshade
    • Vector graphics
      • Alpine paleoglaciers
      • Arctic paleoglaciers
      • Scale bars
      • Natural Earth and GeoPandas
    • Hyoga logo
      • Hyoga logo

Reference

  • Programming interface
    • Configuration
      • hyoga.config
    • Datasets - ds.hyoga
      • xarray.Dataset.hyoga.assign
      • xarray.Dataset.hyoga.assign_icemask
      • xarray.Dataset.hyoga.assign_isostasy
      • xarray.Dataset.hyoga.getvar
      • xarray.Dataset.hyoga.interp
      • xarray.Dataset.hyoga.profile
      • xarray.Dataset.hyoga.where
      • xarray.Dataset.hyoga.where_icemask
      • xarray.Dataset.hyoga.where_thicker
      • xarray.Dataset.hyoga.plot.bedrock_altitude
      • xarray.Dataset.hyoga.plot.bedrock_altitude_contours
      • xarray.Dataset.hyoga.plot.bedrock_hillshade
      • xarray.Dataset.hyoga.plot.bedrock_shoreline
      • xarray.Dataset.hyoga.plot.bedrock_erosion
      • xarray.Dataset.hyoga.plot.bedrock_isostasy
      • xarray.Dataset.hyoga.plot.ice_margin
      • xarray.Dataset.hyoga.plot.surface_altitude_contours
      • xarray.Dataset.hyoga.plot.surface_hillshade
      • xarray.Dataset.hyoga.plot.surface_velocity
      • xarray.Dataset.hyoga.plot.surface_velocity_streamplot
      • xarray.Dataset.hyoga.plot.natural_earth
      • xarray.Dataset.hyoga.plot.paleoglaciers
      • xarray.Dataset.hyoga.plot.scale_bar
    • Input - hyoga.open
      • hyoga.open.dataset
      • hyoga.open.mfdataset
      • hyoga.open.subdataset
      • hyoga.open.atmosphere
      • hyoga.open.bootstrap
      • hyoga.open.example
      • hyoga.open.natural_earth
      • hyoga.open.paleoglaciers
  • Development roadmap
  • What’s new
  • Repository
  • Suggest edit
  • .rst

Examples gallery

Page contents

  • Glacier data
  • Interpolation
  • Shaded relief
  • Vector graphics
  • Hyoga logo

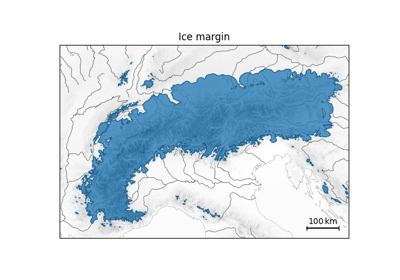
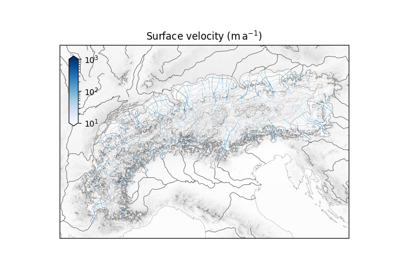
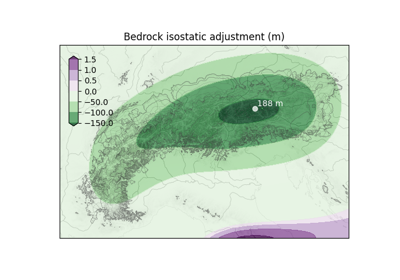
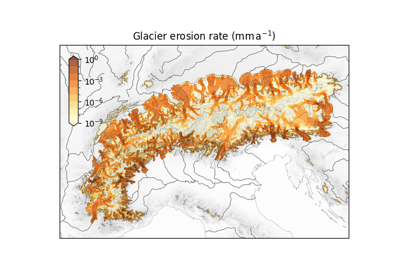
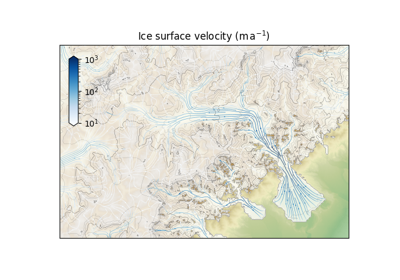
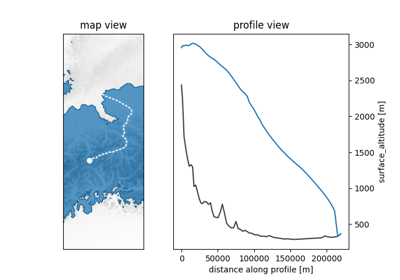
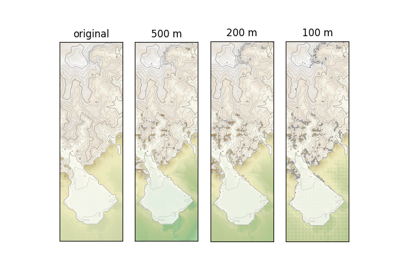
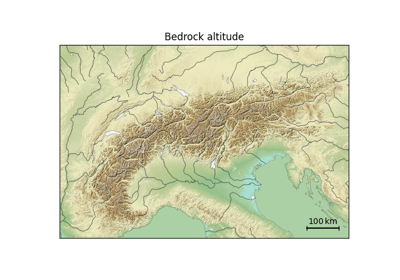
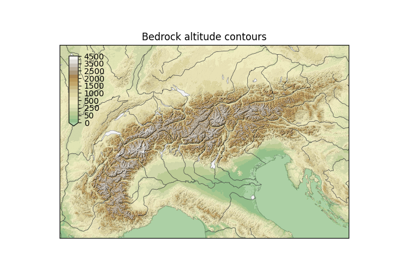
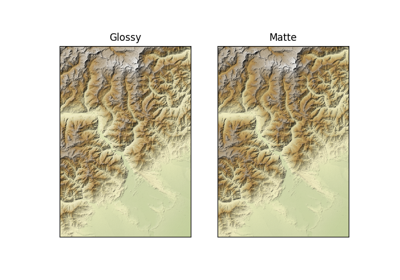
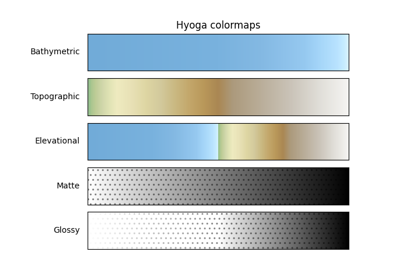
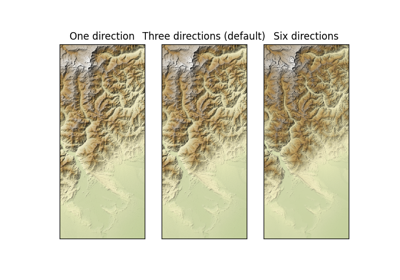
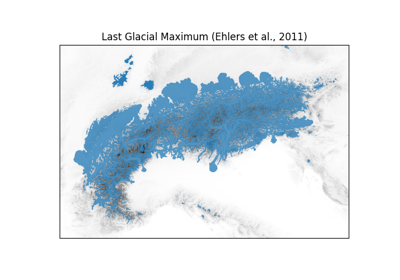
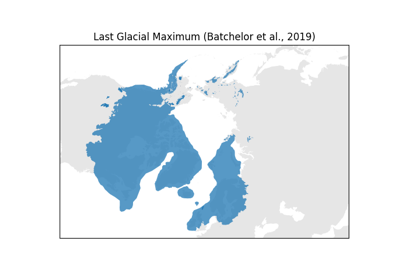
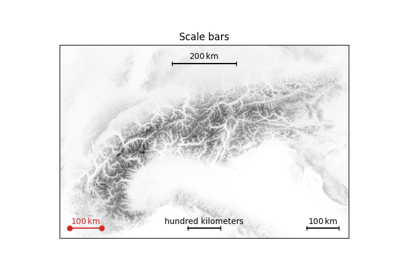
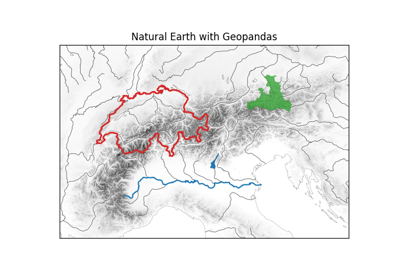
Examples gallery#

This gallery gives an overview of hyoga’s evolving plotting functionality. Click on an image to see the source code used to generate it.

Glacier data#

Surface contours

Surface contours

Ice margin

Ice margin

Surface velocity

Surface velocity

Surface streamplot

Surface streamplot

Bedrock isostasy

Bedrock isostasy

Bedrock erosion

Bedrock erosion

Interpolation#

Interpolated with surface topo

Interpolated with surface topo

Interpolated streamplot

Interpolated streamplot

Profile interpolation

Profile interpolation

Grid refinement

Grid refinement

Shaded relief#

Bedrock altitude

Bedrock altitude

Bedrock altitude contours

Bedrock altitude contours

Hillshade colormaps

Hillshade colormaps

Colormap reference

Colormap reference

Multidirectional hillshade

Multidirectional hillshade

Vector graphics#

Alpine paleoglaciers

Alpine paleoglaciers

Arctic paleoglaciers

Arctic paleoglaciers

Scale bars

Scale bars

Natural Earth and GeoPandas

Natural Earth and GeoPandas

Hyoga logo#

Hyoga logo

Hyoga logo

Download all examples in Python source code: examples_python.zip

Download all examples in Jupyter notebooks: examples_jupyter.zip

Gallery generated by Sphinx-Gallery

previous

Spatial interpolation

next

Glacier data

Page contents
  • Glacier data
  • Interpolation
  • Shaded relief
  • Vector graphics
  • Hyoga logo

By Julien Seguinot

© Copyright 2021-2024.